Graphs in the xy Plane and a Related 3D Surface
By: Taylor Adams
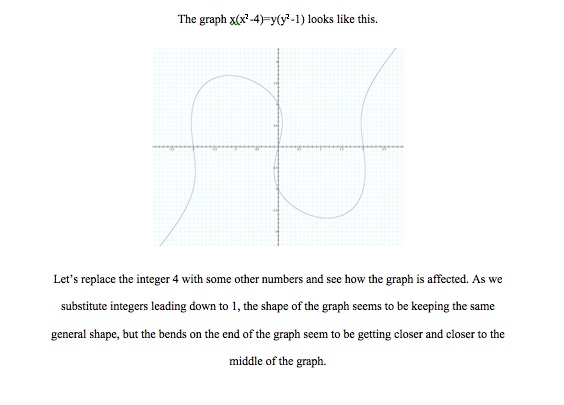
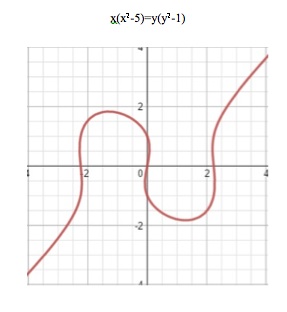
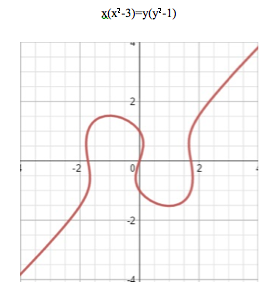
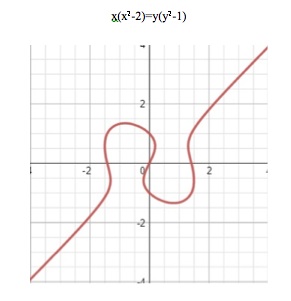
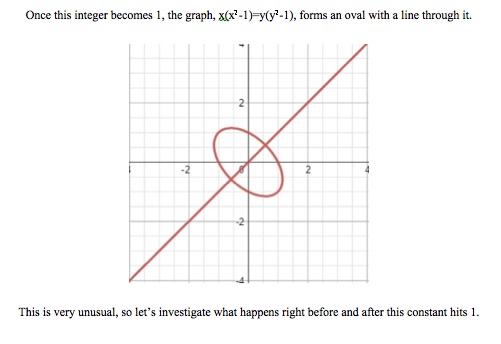
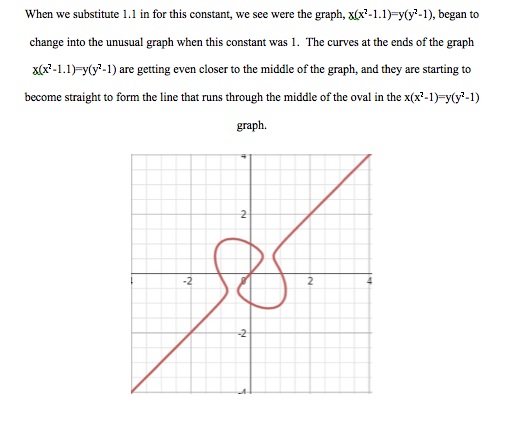
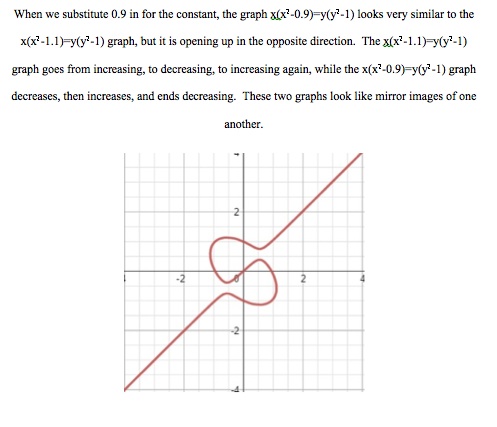
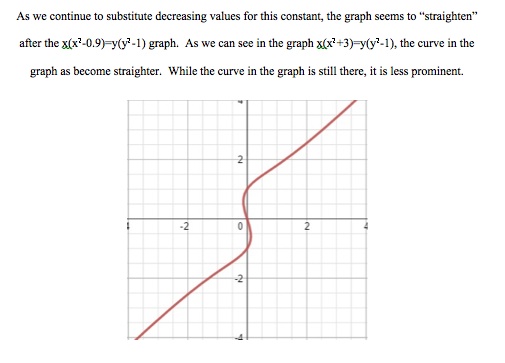
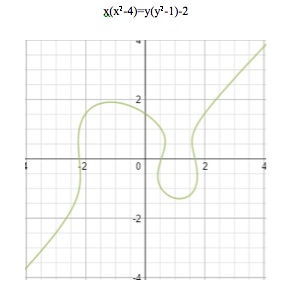
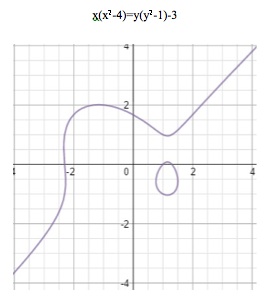
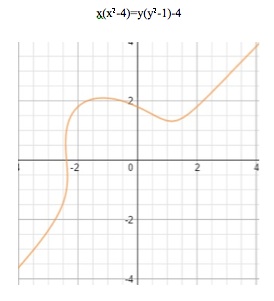
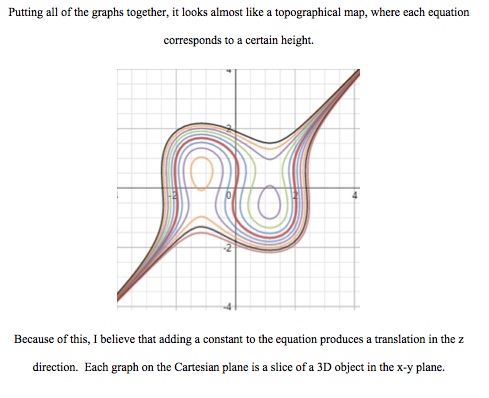
The animation below shows the graph as the constant added to the end of the equaiton moves from -10 to 10.
We can see how the cuves get closer and closser together until they "pinch" together and straighten out.